# Graph anatomy
In this section we'll take a look at various graph features.
# Nodes
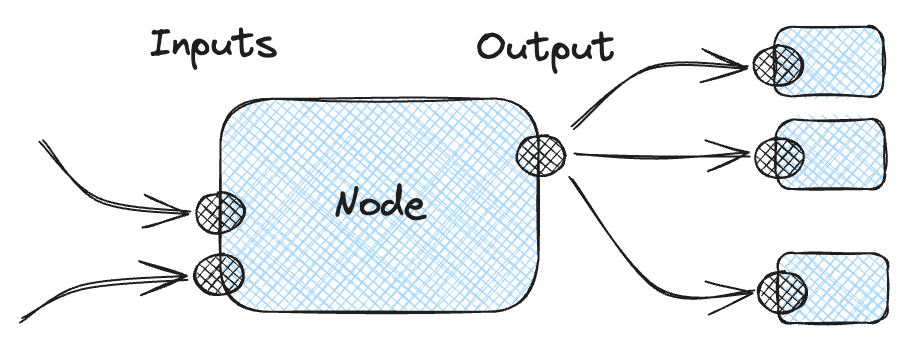
Nodes are the basic building blocks of a graph.
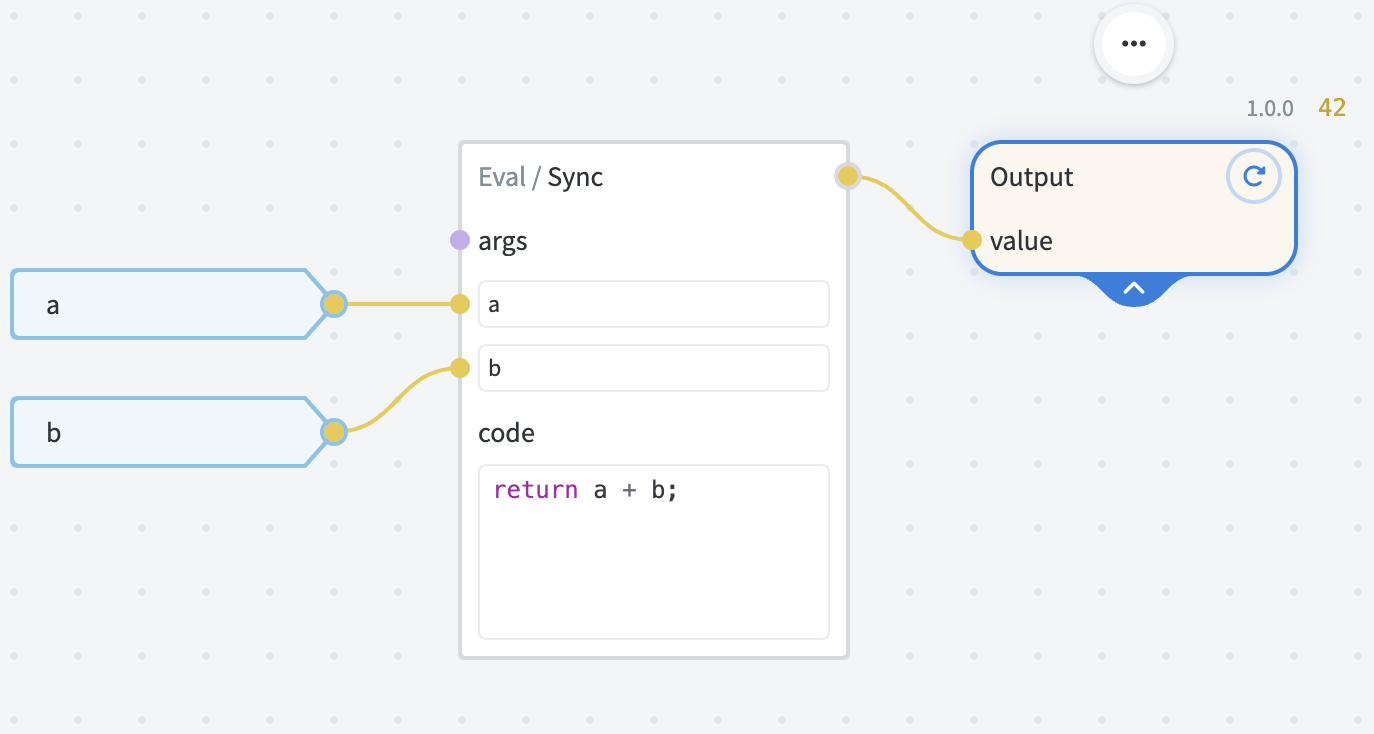
The core premise of node-based visual programming is: each node does one specific thing and produces an output, which can be used as an input to other nodes. By connecting multiple nodes together it is possible to build arbitrarily complex logic.
# Modules
Every node is powered by a specific module. A module dictates which inputs are supported and how an output is calculated.
One simple way of thinking of those is: modules are functions, and each node is a function call with specific arguments.
There are two types of modules:
- published graphs automatically become modules accessible within the same workspace
- native EcmaScript modules written in TypeScript
You can check out the source of Standard Library modules on GitHub.
Modules use structured naming with forward slash (/) as a delimiter.
Name components delimited with / automatically become folders in Graph Lists view.
# Node UI
Select a node to access all its features.
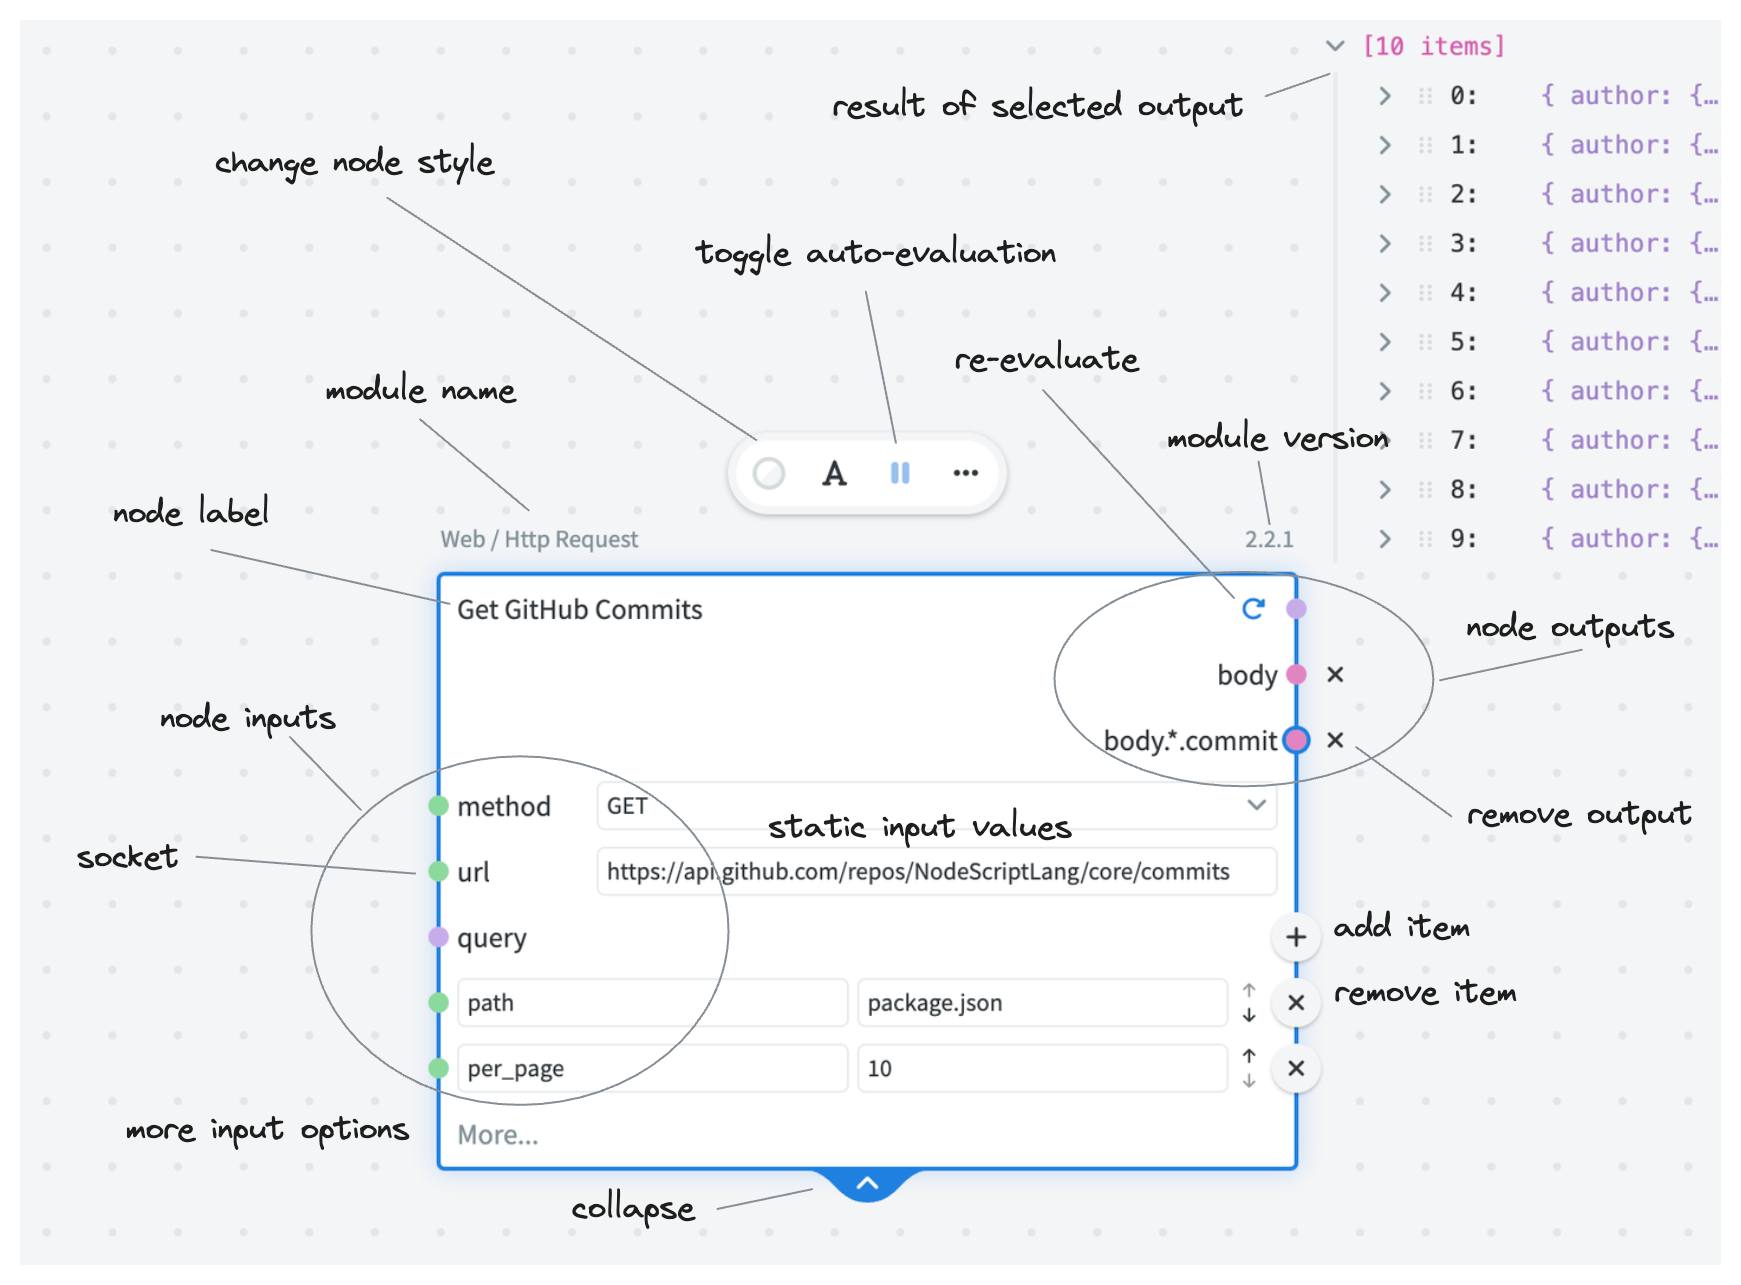
Note: in order to minimize the visual noise most non-essential UI elements are hidden when the node is not selected.
Noteable UI features
When an input has
arrayorobjecttype, a + button appears on the corresponding line — this allows adding one or more items to that array or object. Each item will have its own socket, so every item can be evaluated differently. However, it is also possible to plug a value into the "parent" array/object as well (in which case the individual items will disappear and no longer evaluate).When a node has a custom label, its module name is displayed outside of the node frame when the node is selected.
It is possible to change the node label by double-clicking it, or by pressing the A button on the node toolbar.
Node output result is displayed near the top right corner of the node. If the node has more than one output, the result of the selected output socket is displayed. It is possible to change the displayed output simply by clicking the corresponding socket.
You can add node output either by "dragging out" a value from the result, or by right-clicking the node and clicking "Add node output". The latter method also allows you to specify the output key to use.
Sometimes nodes have additional inputs (also known as "advanced"). Those are hidden by default and can be added by clicking More.... For example, a lot of the features of Http / Request node are hidden by default.
# Frames
Frames provide a way to logically group a number of related nodes. When the frame is moved, all nodes within that frame will move as a group.
You don't have to manually add or remove the nodes to/from the frame: just move the individual nodes inside the frame boundary to add, or outside to remove. You can also resize the frame to change its boundaries — this will not affect the positioning of existing nodes.
It is possible to rename the frame by double-clicking its label. Also, double-clicking anywhere inside the frame will select all the nodes inside.
# Comments
Comments are little post-it notes that you can add directly to the canvas to explain how things work, or to jot down thoughts.
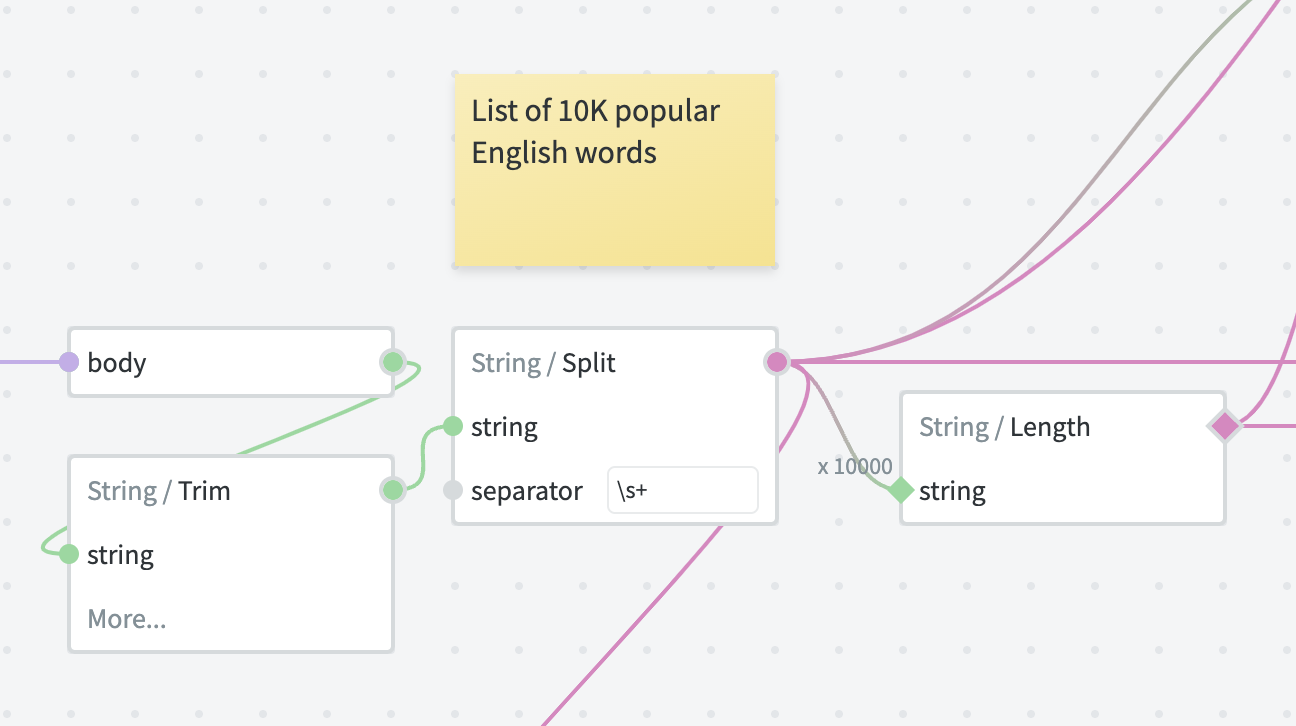
Just like with regular code comments, they can help others understand how to work with your graph or how certain parts of your graph work — but only if used correctly (opens new window).
# Inputs
Remember how nodes have inputs and outputs? Well, the same is the case with the graphs.
Graph inputs have the following purpose, depending on how the graph is used:
When a graph is published as a module and used as a node in other graphs, the inputs will appear on that node.
When a graph is exposed as an endpoint, the inputs will be used to capture request query and body parameters.
# Input settings
The inputs are configured using the Input Settings menu.
Press ⚙️ (cog icon) to access the settings of a particular input. Here you can configure the following:
Type — the data type of an input. Useful tips:
- Always use the most specific type for the job.
- Use
anytype only when actually needed (e.g. when type conversion is not desirable or when working with non-JSON data types).
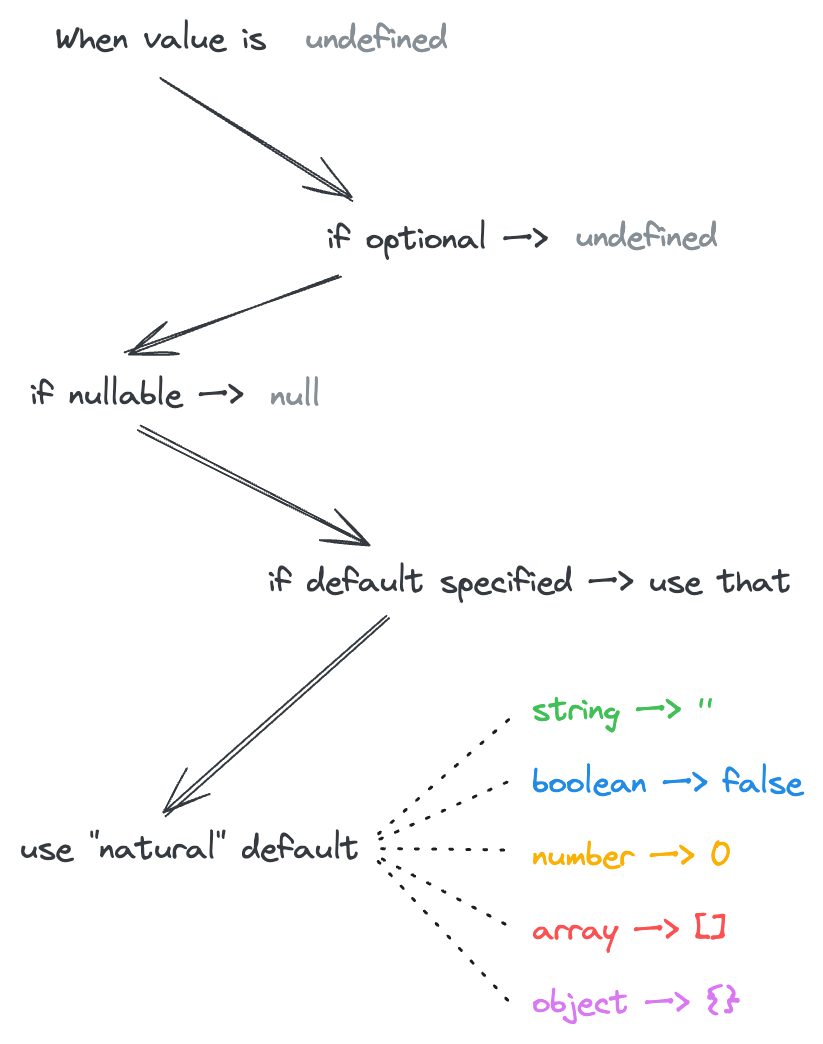
Default — custom default value when no input is provided. By default the "natural" default values are used (e.g.
0for numbers,""for strings,falsefor booleans,{}for objects,[]for arrays)Optional — allow
undefinedas input value- If the input value is not provided,
undefinedwill be used instead of the default value.
- If the input value is not provided,
Nullable — allow
nullas input value- If the value is not provided,
nullwill be used instead of the default value. - If both Optional and Nullable are set and the value is not specified, Optional takes preference (so
undefinedis used).
- If the value is not provided,
Enum (string only) — the list of allowed string values
- Note: if neither Optional nor Nullable are set, the default value should also conform to Enum constraint.
Items schema (arrays only) — schema settings for array items.
Additional properties (objects only) — schema settings for object values.
Deferred (advanced setting) — do not evaluate the input immediately. This allows building custom flow control modules, but requires deep knowledge of graph runtime.
Hide by default — input will be hidden under the "More..." section of the node. If not added explicitly, the default value will be used.
Here's a short infographic explaining how different settings affect the value of an input when it is not specified.
# Input nodes
Once configured, the corresponding Input nodes can be added to the graph to access input data.
There are two types of input nodes that can be used interchangeably:
- Arrow-shaped nodes that access the value of an individual input.
- The Inputs node that provides access to all inputs at once.
# Variables
Variables are a special kind of inputs. They are managed on the workspace level, enabling multiple graphs to share the same data. Sensitive variables are encrypted at rest.
Variables are never shared outside of the workspace. Thus a graph that uses a variable can be published and used by other workspaces, but those workspaces would have to provide their own data to use as variables, because variable values are inaccessible outside of their workspace.
Variables are also automatically filled when the graph is exposed as an endpoint or a schedule.
Security note: encryption at rest means the environment values are stored securely in the NodeScript database. However, the editor will still need the original unencrypted values in order to function properly. Thus any user with access to your workspace technically has access to your secrets.
Please keep this in mind when designing your systems and take extra steps to secure your secrets as and when necessary.
# Output
The Output node captures the result that the graph produces when used as a module or an endpoint.
There can be at most one Output node in a graph.
The schema of the output is configured in the Output Settings menu. Here you can specify the schema settings of the output value, in a similar way to input schema settings.